 Go to Kayako Classic
Kayako Support may occasionally need additional information about the network requests that are generated in your browser. A member of the team may ask you to record a HAR file, or a log of network requests, while that issue occurs. It's also helpful to include any browser console logs in addition to a HAR file.
Click the anchors below to read the instructions to generate a HAR file and console logs in the browser that you use.
Generating a HAR file in Chrome
- Open Chrome and go to the page where the issue is occurring.
- Look for the vertical ellipsis button and select More Tools > Developer Tools.
- From the panel that appears, select the Network tab.
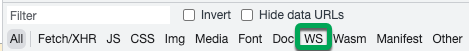
Optional: If Customer Support requests a HAR file with WebSockets, select the WS option in the Network tab. Reload your browser to start seeing the traffic over the WebSocket.
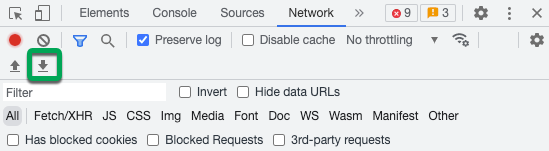
- Look for a round record button in the upper left corner of the tab, and make sure it is red. If it is grey, click the button once to start recording.
- Check the box Preserve log.
- Click the clear button to clear any existing logs from the network tab.
- Reproduce the issue while the network requests are recorded.
- Click the download button, Export HAR, to download, and save the file to your computer: Save as HAR with Content.
- Upload the HAR file to your ticket for further investigation.
The instructions are the same for a MAC computer or a Windows computer. For any issues generating this file, see this article from Google's Help Center: Capture web session traffic.
Retrieving console logs in Chrome
- Open Main Menu for Chrome.
- Navigate to More Tools > Developer Tools.
- Open the Console tab and screenshot any errors that appear.
Generating a HAR file in Firefox
- Open Firefox and go to the page where the issue is occurring.
- Open the Network Monitor.
- Reproduce the issue while the network requests are recorded.
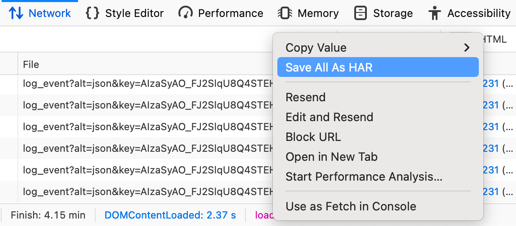
- Right-click anywhere under the File column and click Save All As HAR.
- Save the HAR file somewhere convenient.
- Upload the HAR file to your ticket for further investigation.
The instructions are the same for a MAC computer or a Windows computer. For any issues generating a HAR file in Firefox, see this article from Firefox Source Docs: Network Monitor.
Retrieving console logs in Firefox
- In the Tools menu, select Web Developer.
- Console logs will appear in a separate window.
- Screenshot any errors that appear.
Generating a HAR file in Safari
- Open Safari and go to the Develop menu. If you don't see theDevelop menu, follow the instructions in this article from the Safari User Guide: Use the developer tools in the Develop menu in Safari on Mac.
- Select Show Web Inspector.
- Click the Network tab.
- Reproduce the issue while the network requests are recorded.
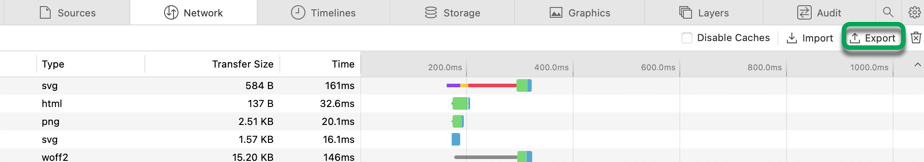
- Click the Export icon and save the HAR file.
- Upload the HAR file to your ticket for further investigation.
For any issues generating a HAR file in Safari, see this article from Safari Developer website: Web Inspector.
Retrieving console logs in Safari
- Open Preferences and navigate to the Advanced tab.
- Select Show Developer menu in the menu bar.
- Close Preferences.
- In the menu bar, select Developer > Show error console.
- Screenshot any errors that appear.
Generating a HAR file in Edge
- Open Edge and go to the Network tool.
- Reproduce the issue while the network requests are recorded.
- Export captured traffic as a HAR file.
- Upload the HAR file to your ticket for further investigation.
For any issues generating a HAR file in Safari, see this article from Microsoft Edge website: Inspect network activity.
Retrieving console logs in Edge
- Select the three dots in the upper-right corner of your browser window.
- Click More tools > Developer Tools.
- In the DevTools panel, click the Console tab.
- Right-click the console and select Clear Console of any pre-existing logs.
- Check the Preserve Log checkbox.
- Replicate the issue that you experienced in the Edge browser.
- Screenshot any errors that appear.
Priyanka Bhotika
Comments